CSI Semiconductor Index vs. STAR 50 Semi: The Style Divergence
2026-10-23

A country index sounds like a broad invitation: buy one basket and participate in an entire economy. The MSCI Korea Index offers something more distinctive. Its exposure to South Korea’s equity market is heavily shaped by Samsung Electronics and SK Hynix, two companies whose fortunes connect Korean stocks to the global demand for memory chips. For investors, that creates a compelling opportunity and a question that deserves careful attention: how much diversification does a country label actually provide?

The central issue is concentration. Samsung and SK Hynix are not simply prominent names inside the benchmark. Their size means that changes in memory pricing, semiconductor investment, and expectations for artificial intelligence can influence the direction of the index. Understanding their combined weight is therefore essential to understanding what an investment in Korean equities really represents.
The MSCI Korea Index is a broad equity benchmark, not a dedicated semiconductor index. Nevertheless, its largest constituents give it a pronounced semiconductor character. The distinction matters: a portfolio can contain businesses from several industries while still deriving much of its market sensitivity from one economic engine.
In the retrieved index snapshot, Samsung Electronics common shares accounted for 35.31%, SK Hynix for 27.58%, and Samsung Electronics preferred shares for another 4.40%. Those figures put the two ordinary-share positions at 62.89%, or 67.29% when Samsung’s separately listed preferred shares are included. These are snapshot weights rather than permanent allocations; market movements and index changes can alter them.
That distinction between two securities and two companies is easy to overlook. Samsung’s common and preferred shares appear as separate index constituents, but they represent exposure to the same underlying business. Anyone measuring the “memory duo” should specify whether the calculation includes both Samsung share classes. Otherwise, two apparently conflicting concentration figures may simply be counting different things.

Market-capitalization weighting does not start by deciding that every sector deserves an equal voice. It gives larger eligible companies more influence, with free-float adjustments reflecting the shares considered available to investors. When a handful of companies become exceptionally valuable, a market-weighted benchmark can become highly concentrated without making an explicit sector bet.
This helps explain why Samsung and SK Hynix matter so much. Their index prominence reflects the scale of their listed equity values, not a committee’s judgment that memory chips should dominate a Korean portfolio. The benchmark follows the investable market, and the investable market can look very different from the broader economy.
Weight also changes with relative performance. If the two semiconductor companies appreciate faster than the rest of the benchmark, their combined share can increase. A passive investor may consequently finish a strong semiconductor rally with greater exposure to the same theme that powered the gains, even without making a new purchase.
Calling Samsung and SK Hynix a duo is useful, but treating them as interchangeable would miss an important part of the investment story. Samsung Electronics combines semiconductor operations with businesses such as smartphones, consumer electronics, and displays. Its share price can therefore reflect developments well beyond memory-chip demand.
SK Hynix offers a more concentrated connection to memory semiconductors. That makes its business mix different from Samsung’s, even when both companies respond to similar industry conditions. Investors should distinguish shared exposure to memory from identical exposure to every product, customer, and earnings driver.
The contrast produces two ways to interpret their index weight. Samsung brings a wider collection of operating businesses, while SK Hynix brings more focused memory exposure. Together they create a powerful semiconductor influence, but their individual performance can diverge as execution, product mix, and market expectations change.

Memory is not one uniform market. DRAM supplies the working memory used while computers and other devices process information. NAND flash retains data without continuous power and supports storage products such as solid-state drives. These technologies serve related digital systems, but their supply conditions, customer demand, and pricing cycles need not move together.
High-bandwidth memory, usually shortened to HBM, is a specialized form of DRAM rather than a completely separate category alongside DRAM and NAND. Its stacked architecture supports rapid data movement in demanding computing applications. That makes it especially relevant to the discussion of artificial intelligence infrastructure.
For an index investor, these distinctions prevent an overly simple conclusion. Strong demand for advanced AI memory does not automatically imply equal strength across every conventional memory product. The earnings outcome depends on what each company sells, how profitably it manufactures those products, and how quickly its product mix changes.
The appeal of the AI memory story is easy to understand. Powerful processors need access to substantial amounts of data, and moving that data efficiently can be as important as performing calculations quickly. Memory therefore becomes part of the infrastructure discussion rather than a background component.
Yet rising demand is only the beginning of the commercial challenge. Manufacturers must deliver the required performance, meet customer specifications, achieve acceptable production yields, and supply products consistently. Technical promise and profitable volume production are related, but they are not the same milestone.
That is why AI enthusiasm should not replace company-level analysis. An investor needs to ask whether anticipated growth is already reflected in the share price, whether new capacity will earn an adequate return, and whether product leadership can be maintained. A promising industry can still produce disappointing stock returns if expectations start too high.
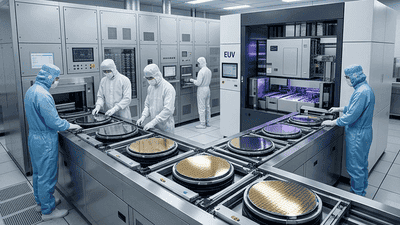
Memory manufacturing requires substantial investment, and capacity cannot always adjust as quickly as customer demand. When demand strengthens ahead of available supply, pricing can improve. When production expands into weaker demand, the balance can reverse. This interaction is central to the industry’s cyclical character.
Product differentiation can modify that cycle, but it does not make every risk disappear. Advanced memory may face different constraints from more standardized products, while customers can still revise spending plans or manage inventories more cautiously. A favorable long-term computing trend does not guarantee smooth quarterly earnings.
For the MSCI Korea Index, the consequence is straightforward. When large constituents share important earnings drivers, a change in the memory outlook can affect a substantial portion of the benchmark at once. The investor is not merely evaluating two corporate balance sheets; the investor is also accepting significant exposure to an industry cycle.
A simple hypothetical illustrates the mechanics. Suppose two holdings together represent 60% of an index and both rise 10%, while every other holding remains unchanged. Their direct contribution would be approximately six percentage points, before allowing for changing weights and other calculation details.
The same arithmetic works in reverse. If those holdings fall 10% under the same assumptions, their contribution would be approximately negative six percentage points. The example is not a forecast. It shows why a large collection of smaller constituents may struggle to offset a substantial move in the dominant pair.
Actual performance is more complicated because Samsung and SK Hynix do not necessarily move together. Their individual weights matter, as do dividends, currency treatment, and the performance of the remaining constituents. Still, contribution analysis offers a better explanation of benchmark behavior than simply counting how many companies it contains.
Geographic exposure and economic exposure are not identical. A company can be listed in South Korea while selling into international markets and responding to global investment decisions. The country in which its shares trade does not define the full set of forces shaping its profits.
For Samsung and SK Hynix, global electronics demand, data-center investment, and semiconductor competition help connect the Korean benchmark to events elsewhere. This is one reason a Korea allocation may behave differently from an investment thesis based primarily on domestic consumption or local economic growth.
Currency adds another layer. An unhedged foreign investor’s return depends partly on how the Korean won moves against the investor’s home currency. Company earnings can also be affected by currencies through revenue and cost exposures, but that operating effect should not be confused with the translation of portfolio returns.
An ETF carrying “Korea” or “MSCI Korea” in its name does not necessarily reproduce the uncapped parent index’s weights. Some products track modified benchmarks with concentration limits. Those rules can reduce the influence of a large constituent or redistribute exposure across the rest of the portfolio.
This creates an important distinction between discussing the MSCI Korea Index and discussing an investable fund. The index snapshot describes a benchmark at a particular point in time. A fund’s actual holdings depend on its precise benchmark, implementation, cash position, and other practical considerations.
Before interpreting the memory duo’s weight, investors should identify the exact index version and examine the fund’s holdings date. Samsung preferred shares deserve a separate check. Comparing an uncapped index figure with a capped ETF allocation can otherwise produce a misleading impression that one of the numbers is wrong.
Concentration is not automatically undesirable. A portfolio may deliberately seek exposure to businesses positioned around an important technology trend. The problem arises when investors believe they have purchased broad diversification but have actually increased an existing dependency.
Someone already holding semiconductor shares, technology funds, and AI-related investments should look through the country label. A Korea allocation may add different companies and a different currency while still reinforcing sensitivity to global technology spending. Geographic diversification can therefore coexist with overlapping economic risks.
A useful portfolio review separates three questions. How much is allocated to Korean-listed equities? How much is allocated to semiconductors and memory? And how much depends on the same customer spending cycle? Answering only the first can leave the most consequential exposure hidden.
The combined index percentage is a starting point, not a complete investment framework. A more useful monitoring list connects the companies’ operating performance with the expectations embedded in their valuations:
These indicators help distinguish a stronger business outlook from a stronger investment opportunity. Improved profitability may already be anticipated, while temporary weakness may be priced too pessimistically. Index dominance tells investors where to focus their attention; it does not, by itself, tell them what price is attractive.
Samsung and SK Hynix give the MSCI Korea Index a distinctive identity: a national equity benchmark with unusually strong exposure to the memory semiconductor ecosystem. That identity can be attractive to investors seeking participation in global computing demand, but it is not equivalent to an evenly distributed investment across the Korean economy.
The most useful interpretation combines weight, business mix, industry conditions, and valuation. Count both Samsung share classes when measuring company exposure, distinguish the parent index from capped products, and remember that technological importance does not eliminate investment risk. The memory duo’s dominance is neither a flaw nor a guarantee. It is the defining exposure that investors need to understand.